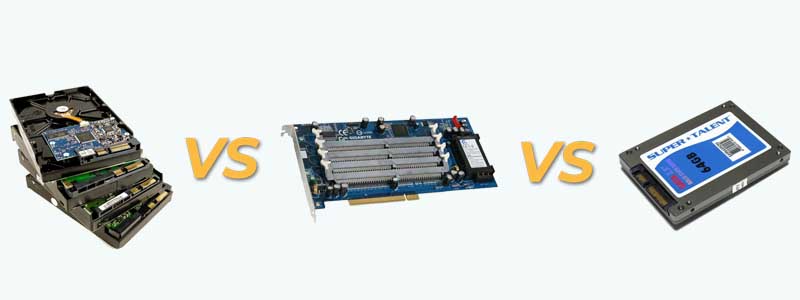
In this article we are going to introduce to you two solid state drives from Samsung and a unique data storage solution from Gigabyte aka i-RAM. Let check out their performance compared to that of conventional hard disk drives.
Solid State Drives (SSDs) have been a subject of hot arguments since their very announcement. After all, it is the first serious attempt to challenge magnetic storage devices that have long remained unrivalled on the market.
We’ll take two SSDs from Samsung to see what differentiates them from the traditional Hard Disk Drive. We’ll have some theory first.
In the hard disk drive information is stored on magnetic platters rotating at a high speed. This information is written to and read from the platters by a block of read/write heads. A microcontroller controls the movement of the heads relative to the platters, communicates with the external interface, and works with the cache buffer. Thus, the data-transfer speed depends on the rotation speed of the platters and on the areal data density. Of course, the interface has a limited bandwidth, too, but the interface speed of today’s HDDs is far higher than the speed of reading from the platters. So, the interface only matters for external HDDs which will not be discussed in this article. When processing a large number of small-size data blocks, the HDD’s performance is affected by the algorithms of working with the cache memory which are written into the HDD’s firmware. The reordering of write requests and look-ahead reading influence performance greatly. It’s because data can be stored in different parts of the platters and when the load is random or nearly random (which is typical for many applications from databases to any large collection of small enough files, e.g. your web-browser’s cache) it takes quite a lot of time just to move the heads to the necessary spot above the platter. A mixed load – when the drive has to process a number of requests to two or more zones of the platters – is also difficult. The heads have to be moved actively between the zones – it is then that you can hear the rattle of the heads (the platters do not produce much noise with their rotation).
It’s all different with Solid State Drives which store data in a few flash memory chips governed by a microcontroller. Flash memory is EEPROM or Electronically Erased Programmable Read-Only Memory. It consists of a number of cells based on NAND or NOR logic. This type of storage features a very low read time (the necessary cell only has to be found and read) but a rather high write time (the existing data must be erased from the cell before writing new data into it). The access time is increased greatly for multi-level cell organization. As opposed to the single-level cell design, when writing you have to read all data from the cell, modify them, erase the cell, and then write new data. However, MLC memory is cheaper to manufacturer and offers larger storage capacities.
So, what are the advantages of Solid State Drives? First of all, it is the low access time for read operations. Second, the consequence of the low read access time, an SSD features a very high speed of random reading, which is comparable to its sequential read speed. With flash memory, it takes about the same time to access sequential and random cells. Third, the lack of mechanical parts should ensure low power consumption, noiseless operation and protection against vibration. In fact, you can only render flash memory inoperable if you physically break it.
On the downside is the lower speed of sequential operations in comparison with the HDD and the limited lifecycle of the cells. Flash memory can only sustain about 100 thousand rewrite operations for each cell. That’s quite a lot, especially as modern controllers can distribute data along the drive to load all cells uniformly. However, this factor should be kept in mind until we have trustworthy information about the service life of SSDs.
What applications can be suggested for these rather expensive (in terms of the cost of storing 1GB of data) drives? First of all, it is industrial computers and advanced supercomputers. For the former, the high tolerance to vibrations is important. By the way, early flash-based drives were demanded exactly as storage devices with high tolerance to the environment. They were welcomed in military science, but for other applications their price was yet too high then. As the price was lowering, this storage type became interesting for other clients as well. Eventually, flash drives made it into retail.
As for large computing systems, there are a lot of benefits: high reliability, high random-read speed due to low access time, low heat dissipation and small dimensions. The latter two factors proved to be crucial for single-unit server platforms. For example, the Intel SR1550AL can accommodate six 2.5” drives. If you install SSDs, you get a superb RAID array capable of processing a huge number of operations per second. And it will only take one slot in the server rack! Notebooks, especially compact notebooks, can benefit from SSDs as well because the size and power consumption of the drive is important there. SSDs have already begun to steadily conquer that market, ousting small-capacity and slow 1.8” HDDs. We can recall the Apple MacBook Air and Toshiba Portege R500-10U as examples.
So, that’s the theory. How do things stand with modern SSDs in practice? Let’s check it out. The SSD class will be represented by two devices from Samsung designed in 2.5” form-factor with capacities of 32GB and 64GB. These SSDs will be compared with the best-in-class HDDs:
- Hitachi 7K200 (2.5” form-factor, 7200rpm spindle rotation speed, 16MB buffer, SATA interface, 200GB capacity)
- Samsung SpinPoint F1 (3.5” form-factor, 7200rpm spindle rotation speed, 32MB buffer, SATA interface, 1000GB capacity)
- Fujitsu MBA3300RC (3.5” form-factor, 15,000rpm spindle rotation speed, 16MB buffer, Serial Attached SCSI interface, 300GB capacity)
As a representative of quite another category, we took a Gigabyte i-RAM, a device that uses RAM modules for storing data. We’ll describe it shortly.
The HDDs are quite familiar to us, but the new devices, including the i-RAM, will be discussed in more detail below.
Testing Participants
Samsung SSDs: 32GB and 64GB
We got two SSDs from Samsung designed in the 2.5” HDD form-factor.
What’s Inside
Testing Participants
Samsung SSDs: 32GB and 64GB
The MCAQE32G5APP-0XA model has a storage capacity of 32 gigabytes and a UDMA66 interface.
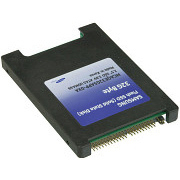
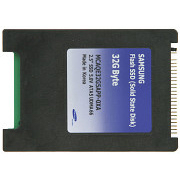
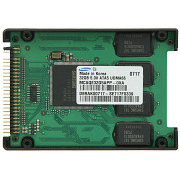
The MCBQE64GBMPP-03A has a capacity of 64GB and a SATA interface.
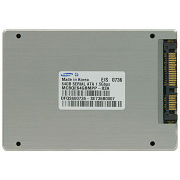
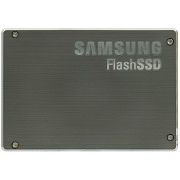
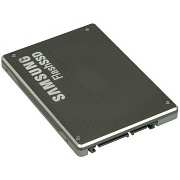
As you can see, the design is very simple. There is a PCB inside a plastic (the first model) or aluminum (the second model) case. The PCB carries memory and controller chips. While the maximum capacity of HDDs is limited by the areal density and the number of platters in the case (not more than five platters), the limiting factors for these devices are the capacity and the size of the memory chips. For example, the 32GB MCAQE32G5APP-0XA drive uses sixteen 16Gb chips (four can be seen in the photo and the remaining twelve populate the reverse side of the PCB).
SSDs are identified by the OS as an ordinary hard disk, provoking no problems with installation.
Gigabyte i-RAM
This is an even more unconventional storage device than SSDs. It was introduced quite a while ago, but it’s in this review that we want to compare it with other storage types.
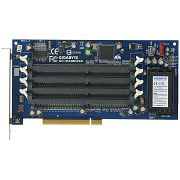
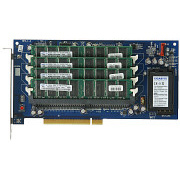
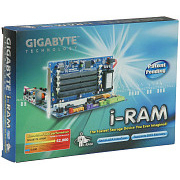
The point of i-RAM is simple and obvious from its appearance. The PCB with a PCI connector has four slots for DDR memory modules. So, this device uses DDR SDRAM, which is far faster than HDDs or flash memory, for storing data. SDRAM is volatile, and there is a 1.7Ah battery on the PCB to ensure data integrity when the PC is shut down. When working, the i-RAM is powered by the PCI bus. The manufacturer claims the battery can last for 16 hours but we wouldn’t recommend you check this out practically because all data will be lost as soon as the battery is depleted. If you are planning on storing valuable data on your i-RAM, we recommend you to equip your PC with an uninterruptible power supply. A UPS can keep a computer up and running for long in idle mode.
The i-RAM uses SATA as the external interface.
Now we have to mention the downsides of this interesting device. First, it only supports DDR SDRAM which is currently more expensive than DDR2. Gigabyte has promised to introduce a new i-RAM with DDR2 modules, but it is still only a promise so far. There are four memory slots meaning that the maximum available capacity is 4 gigabytes. The speed of the memory is unimportant because the slowest SDRAM is going to be far faster than the SATA interface. By the way, the i-RAM supports the first version of the SATA protocol with a bandwidth of 150MB/s. That’s sad because SATA II might improve bandwidth and performance twofold! The memory slots are placed at an angle, and the i-RAM blocks the neighboring PCI slot when installed into the PC.
Testbed and Methods
The following testing utilities were used:
- IOMeter 2003.02.15
- WinBench 99 2.0
- FC-Test 1.0
- PCMark 2004
- PCMark 2005
- PCMark Vantage
Testbed configuration looked as follows:
- Albatron PX865PE Pro II mainboard
- Intel Pentium 4 2.4GHz CPU
- IBM DTLA-307015 system disk, 15GB
- Radeon 7000 32MB graphics card
- 256MB DDR2-533 SDRAM
- Microsoft Windows XP Professional SP2
We installed the generic OS drivers for the drives and formatted them in FAT32 and NTFS as one partition with the default cluster size. For some tests 32GB partitions were created on the drives and formatted in FAT32 and NTFS with the default cluster size, too. The SATA interface was provided by a Promise SATA300 TX4302 controller. The SAS interface was provided by an LSI SAS3041E-R controller.
Performance in Intel IOMeter
Sequential Read & Write Patterns
IOMeter is sending a stream of read and write requests with a request queue depth of 4. The size of the requested data block is changed each minute, so that we could see the dependence of the drive’s sequential read/write speed on the size of the data block. This test is indicative of the highest speed the drive can achieve.
The numeric data can be viewed in tables. We’ll discuss the diagrams.
- IOMeter: Sequential Read results (table)
- IOMeter: Sequential Write results (table)
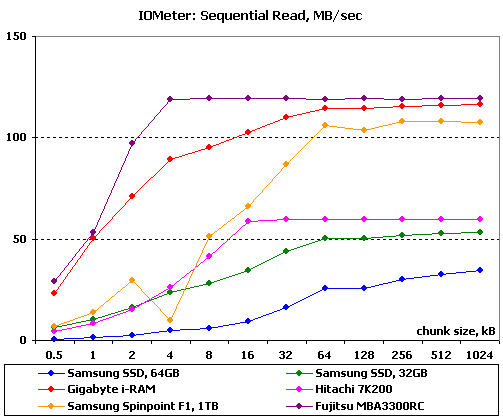
As might have been expected, the SSDs cannot compete with the HDDs at sequential operations. There is some competition on small data chunks, but the HDDs go ahead on large chunks, even the 2.5” Hitachi 7K200 having a higher maximum speed than the SSDs. The gap isn’t large, though. The SSDs are roughly similar to 5400rpm 2.5” HDDs in terms of sequential reading.
Note that the 32GB SSD with the slower UATA66 interface is faster than the 64GB model with the SATA interface. Perhaps the higher capacity is achieved by means of slower chips? Or is it just the way the SSDs behave in this particular test? We’ll find the answer in the other tests.
As for the i-RAM, it is only inferior to the 15,000rpm drive from Toshiba. And it must be due to the i-RAM using a 150MB/s SATA interface (the interface’s practical bandwidth is even lower as you can see). Its performance might be better with SATA II.
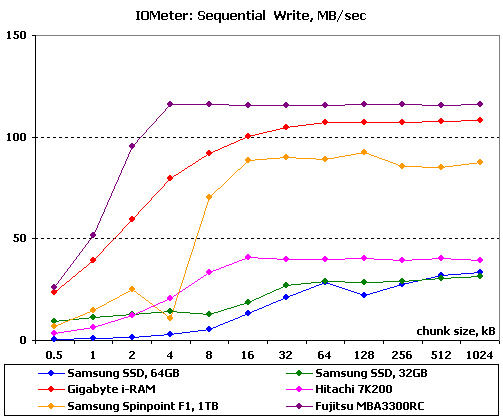
We see the same overall picture at sequential writing as in the previous test. There are certain differences, though. The 64GB SSD is not so far behind the 32GB model while the latter is ahead of the Hitachi 7K200 on small data blocks and even ahead of the Samsung F1 on 512-byte blocks.
Disk Response Time
In this test IOMeter is sending a stream of requests to read and write 512-byte data blocks with a request queue of 1 for 10 minutes. The total number of requests processed by the HDD is over 60 thousand, so we get a sustained response time that doesn’t depend on the HDD’s buffer size.
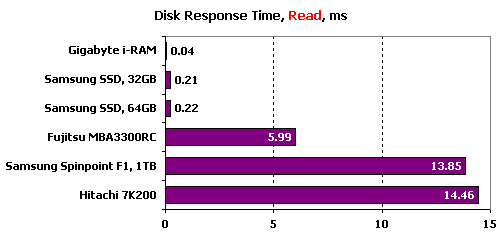
Based on SDRAM, the i-RAM is the only device that can beat the SSDs in terms of read access time. As for HDDs, even Fujitsu’s drive with a SAS interface and a spindle rotation speed of 15,000rpm (it is the rotation speed that largely determines the read access time of a HDD; the areal density has a smaller effect) proves to be 30 times as slow as the SSDs. The more widespread 7200rpm HDDs are even slower.
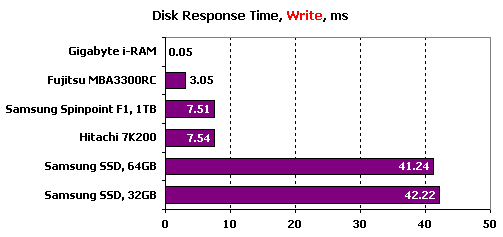
The SSDs fall behind in terms of write access time, though. The HDDs’ access time is about two times better than at reading because write requests are first entered into the cache memory and then, in optimized order, written to the platters. An SSD has to write directly to memory and flash memory has never had a high write speed. By the way, comparing SSDs with modern memory cards and USB flash drives, we can see that they use fast chips, yet not the fastest available. Perhaps some fast cache memory would help organize simultaneous writing into different flash modules, but this is not implemented yet.
The i-RAM is ahead of the other devices, enjoying a huge lead. Writing and reading into SDRAM modules takes almost no time at all if compared with the drives.
Random Read & Write Patterns
Now we’ll see the dependence between the drives’ performance in random read and write modes on the size of the data block size.
- IOMeter: Random Read results (table)
- IOMeter: Random Write results (table)
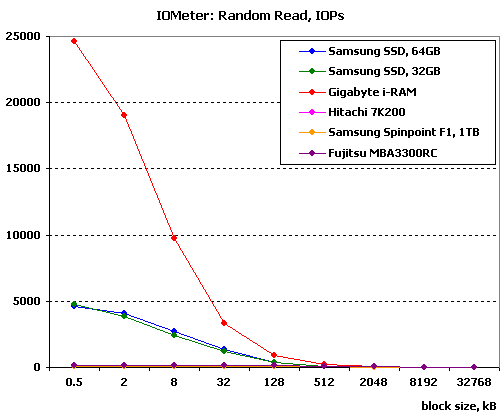
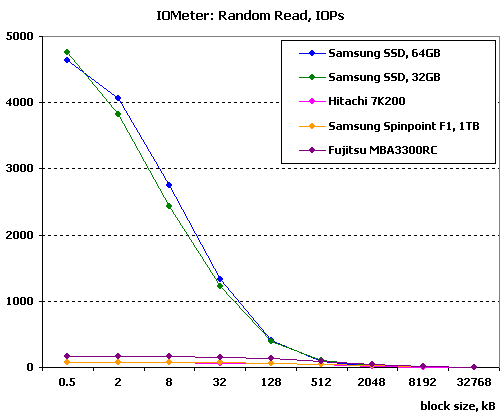
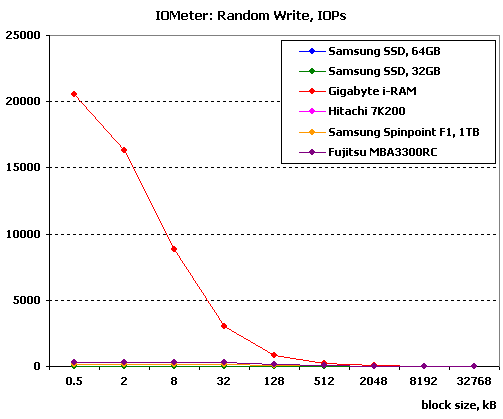
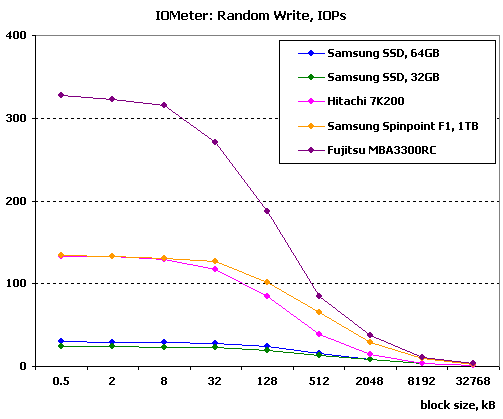
Here and elsewhere the advantage of the i-RAM over the others is so huge that we had to build two diagrams for each test: one to show all the devices and the other to show all of them without the i-RAM. Otherwise, the graphs of the others just merge into one line when compared to the graph of this very fast device.
It is in this test that we can see the difference between SSDs and HDDs. The SSDs provide much higher speeds than HDDs on every data chuck size except for the largest ones (but small data chinks are the most common in real-life applications). Even the SAS-interfaced 15,000rpm drive from Fujitsu barely stands out among the 7200rpm SATA drives in comparison with the flash-based drives.
The i-RAM is beyond comparison as its random read speed is unachievable for the others.
Database Pattern
In the Database pattern the drive is processing a stream of requests to read and write 8KB random-address data blocks. The ratio of read to write requests is changing from 0% to 100% throughout the test while the request queue size varies from 1 to 256.
We’ll discuss the results for requests queue depths of 1, 16 and 256.
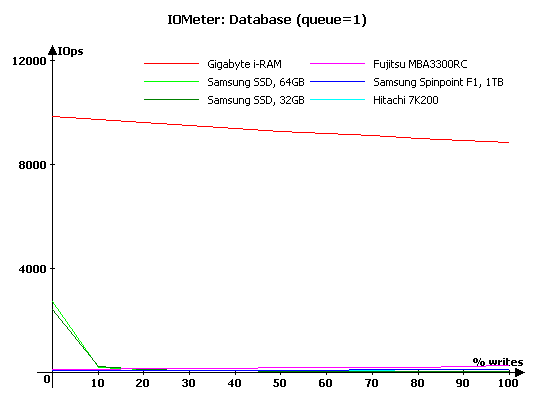
As you might have expected, the i-RAM is unrivalled. Note that it copes better with reading than with writing, yet its speed in fantastically high in both cases.
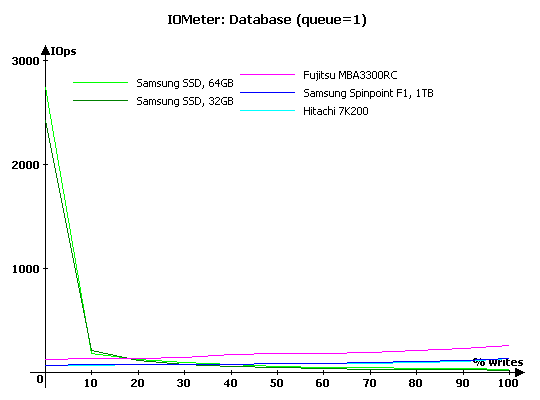
As for the SSDs, they are faster than HDDs at random reading when there are no write requests. But as soon as there are even 10% of writes in the queue, the SSDs slow down suddenly, although are still ahead of the HDDs. As the percentage of writes grows up, the 15,000rpm HDD takes the lead, and then the other HDDs go ahead of the SSDs. As opposed to the SSDs, the performance of the HDDs is growing up along with the percentage of writes thanks to the deferred writing mechanism.
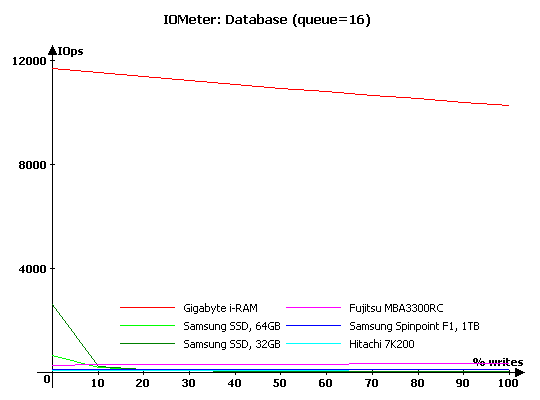
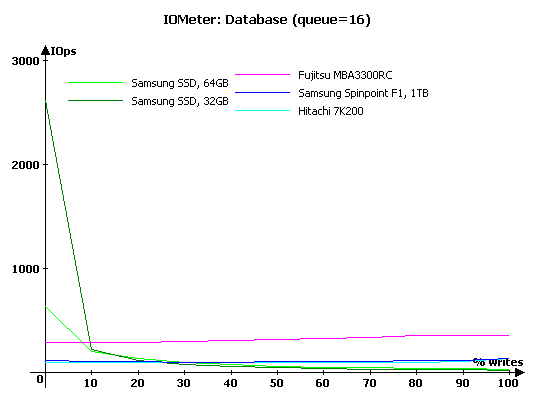
The i-RAM performs even better when the queue is 16 requests long. The same is true for the HDDs, the Fujitsu outperforming the SSDs even at 10% write requests. There’s something strange about the behavior of the 64GB SSD. While the 32GB model is indifferent to the increase in the queue depth (because there is nothing to optimize), the 64GB model is slower at read requests. Is this some error in the controller and driver?
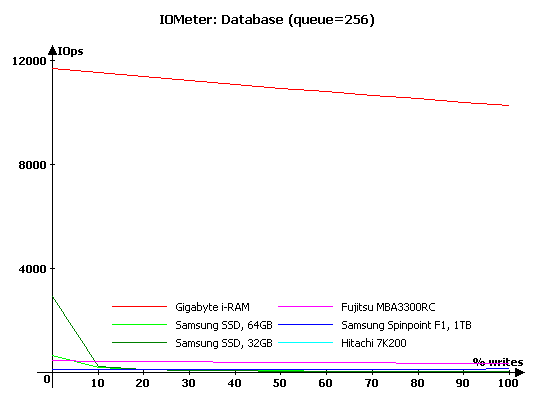
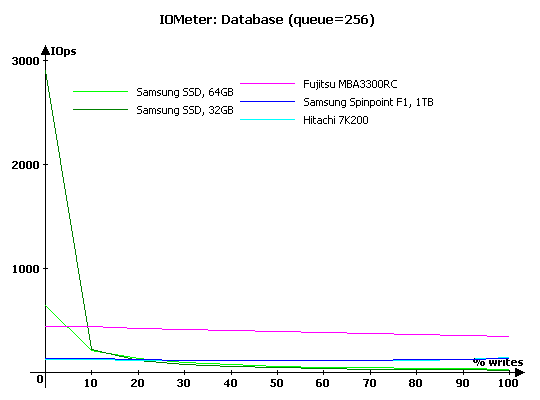
There are no significant changes when the queue depth is increased further.
Here are a couple of diagrams that show graphs for five different requests queue depths for each drive.
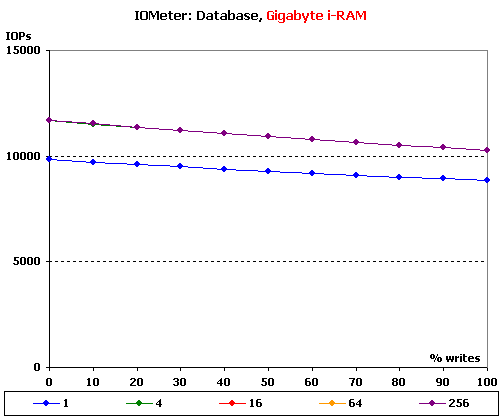
The performance of the i-RAM is higher by about 20% at every queue depth other than 1.
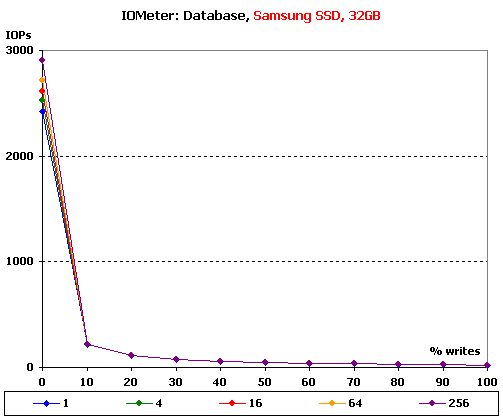
It’s simple with the 32GB SSD: its performance is constant at every queue depth and in every mode, save for pure reading, and is determined by the write access time and the ratio of reads to writes. At pure reading the performance is increasing steadily along with the request queue depth.
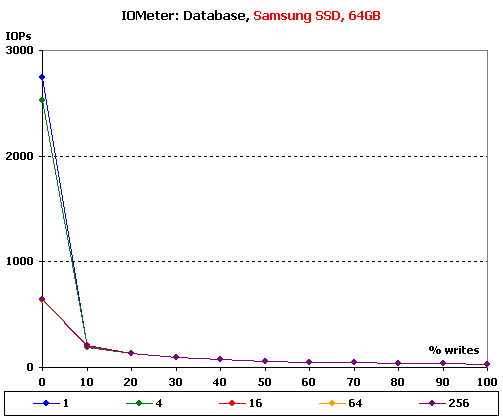
The 64GB SSD behaves differently. It shows its maximum performance at a requests queue of 1. When the queue is 4 requests long, the SSD is somewhat slower. But when the request queue is increased further, the drive suffers a terrible performance hit to a certain level that does not depend on the specific length (16 or 256 requests). This drive’s controller seems to be unable to cope with long request queues.
Here are the same diagrams for the other tested devices:
- IOMeter: Database, Fujitsu MBA3300RC (diagram)
- IOMeter: Database, Samsung SpinPoint F1 (diagram)
- IOMeter: Database, Hitachi 7K200 (diagram)
Multi-Threaded Read & Write Patterns
The multi-threaded tests simulate a situation when there are one to four clients accessing the hard disk at the same time. The depth of the outgoing request queue is varied from 1 to 8. You can follow the links below to see tables with results, but we’ll discuss diagrams for a request queue of 1 as the most illustrative ones. When the queue is longer, the speeds depend but little on the number of applications.
- IOMeter: Multi-threaded Read results (table)
- IOMeter: Multi-threaded Write results (table)
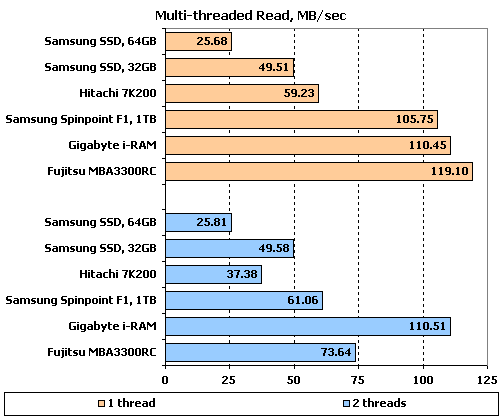
Samsung’s SSDs are slow at reading one thread due to their low speed of sequential reading. When a second thread is added, the HDDs slow down by 33% whereas the SSDs and i-RAM take no notice of the different type of load. As a result, the i-RAM is faster than the Fujitsu MBA3300RC at two threads while the 32GB SSD from Samsung is faster than the Hitachi 7K200.
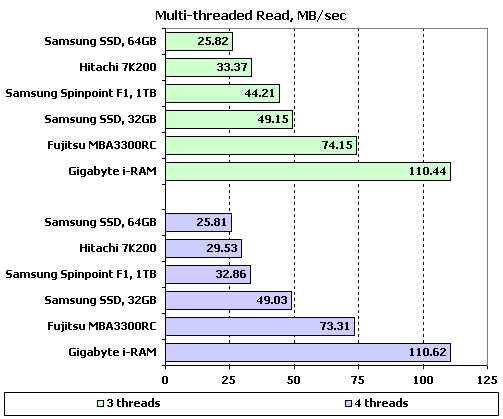
When there are even more threads to be processed, the Samsung SpinPoint finds itself lagging behind the 32GB SSD.
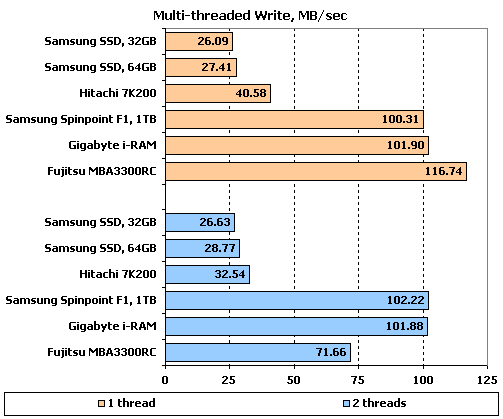
When writing one thread, the drives are ranked up just like at reading. When we add a second thread, the Fujitsu MBA3300RC slows down heavily and the Hitachi 7K200 is slower too, but the SSDs and the Samsung SpinPoint F1 increase their speed somewhat. The SSDs get close to the 2.5” HDD, and the Fujitsu falls behind the i-RAM and the 1TB HDD.
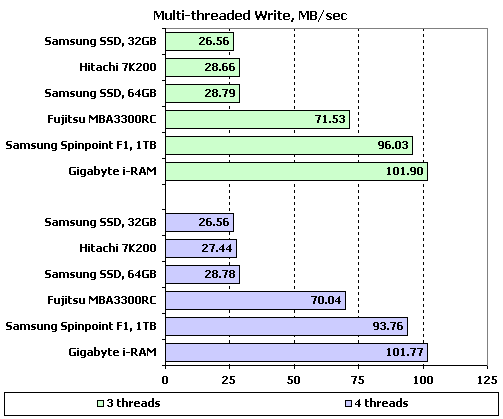
The SSDs are equal to the Hitachi 7K200 at writing 3 and 4 threads while the i-RAM becomes the leader as the SpinPoint slows down a little.
Web-Server, File-Server, Workstation Patterns
This group of tests simulates disk loads typical of servers and workstations. The names of the patterns are self-explanatory. The Workstation pattern is used with the full capacity of the drive as well as with a 32GB partition. The request queue is limited to 32 requests in the Workstation pattern.
The results are presented as performance ratings. For the File-Server and Web-Server patterns the performance rating is the average speed of the drive under every load. For the Workstation pattern we use the following formula:
Rating (Workstation) = Total I/O (queue=1)/1 + Total I/O (queue=2)/2 + Total I/O (queue=4)/4 + Total I/O (queue=8)/8 + Total I/O (queue=16)/16…
- IOMeter: File-Server (table)
- IOMeter: Web-Server (table)
- IOMeter: Workstation (table)
- IOMeter: Workstation, 32GB (table)
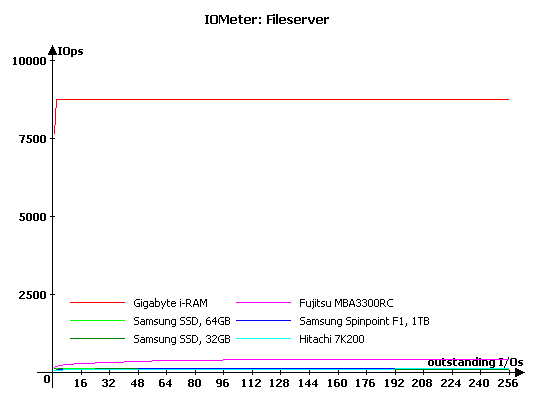
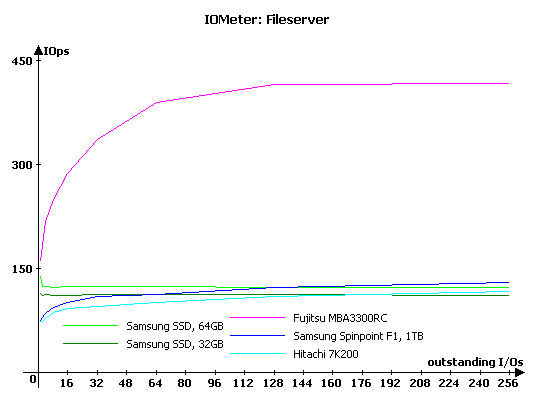
Again, the Gigabyte i-RAM is far faster than its opponents. Among the other drives, the 15,000rpm Fujitsu is superior. The SSDs are faster than the HDDs from Samsung and Hitachi at small queue depths, the 32GB model delivering higher performance than the 64GB one. The HDDs accelerate as the request queue is getting longer. Eventually, the Samsung SpinPoint F1 goes ahead of the 32GB SSD while the 64GB SSD finds itself to be the slowest drive of all.
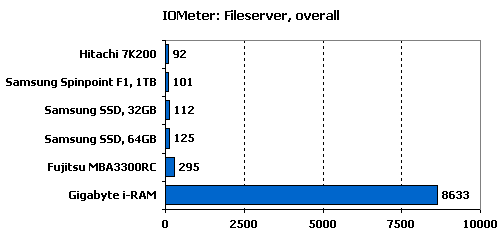
High IOps results at small request queue depths help the SSDs get a higher performance rating than the 7200rpm HDDs have. Take note how much better the Gigabyte i-RAM is in comparison with its opponents.
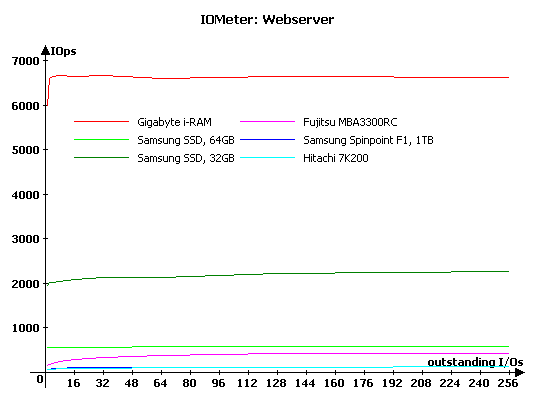
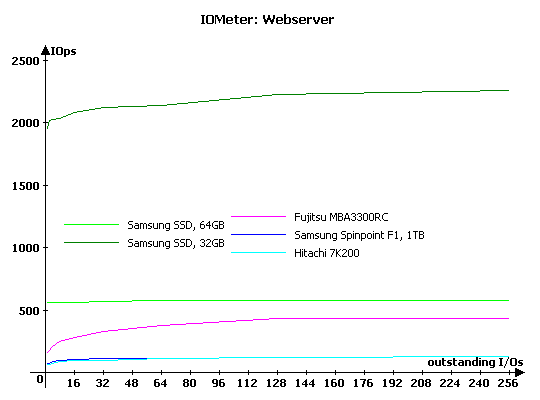
As opposed to the previous pattern, we have no write requests here, and the SSDs find this load much easier to cope with. Even the Fujitsu MBA3300RC cannot compete with the slower 64GB model while the 32GB SSD is far ahead. Of course, the i-RAM remains an unrivalled leader, but the gap is not as huge as in other tests.
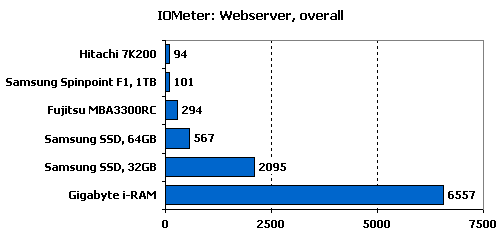
The performance ratings agree with what we’ve seen in the diagram.
Performance in WinBench 99
We’ll use WinBench to record data-transfer graphs:
- Samsung 32GB SSD
- Samsung 64GB SSD
- Gigabyte i-RAM
- Fujitsu MBA3300RC
- Samsung SpinPoint F1, 1GB
- Hitachi 7K200, 200GB
The next diagram shows the data-transfer rate at the beginning and end of the partition:
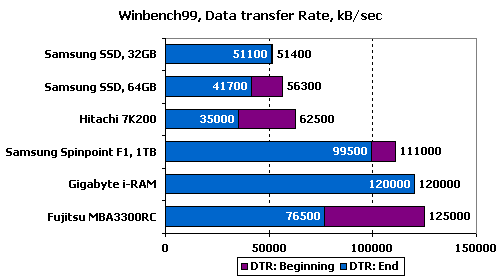
There are a few interesting points here. First of all, the reduction of speed at the end of the 64GB SSD is merely an error of the test program: every cell has the same speed, of course. Second, you can see that the SSDs have a much higher read speed than in the IOMeter: Sequential Read test. You’ll see shortly how they perform under real-life conditions. And third, you can see where the SSDs and i-RAM differ from the HDDs clearly: they have the same speed through all of the drive’s capacity. As a result, the i-RAM will have a somewhat higher average speed than the Fujitsu MBA3300RC, and the SSDs will be no worse than the Hitachi 7K200.
Performance in FC-Test
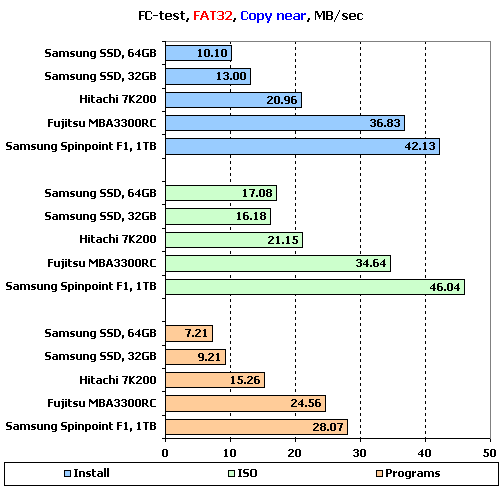
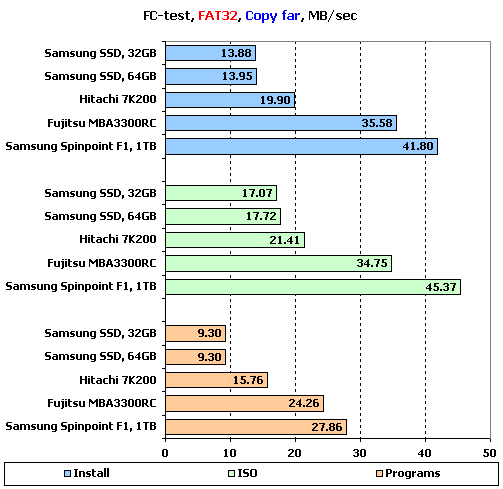
Now we will check performance of the hard disk drives with the FC-Test program whose results are closer to real applications than the results of purely synthetic benchmarks. Two 32GB partitions are created on the drives and formatted in NTFS and then in FAT32. After that a file-set is created of the hard disk. It is then read from the disk, copied within the same partition and then copied into another partition. The time taken to perform these operations is measured and the speed of the drive is calculated.
The Gigabyte i-RAM having a capacity of 4GB only, we only checked out its read and write speed (FC-Test needs larger partitions for the copy tests than what can be created on this drive).
To remind you, the Windows and Programs file-sets consist of a large number of small files whereas the other three patterns (ISO, MP3, and Install) include a few large files each.
This test produces too much data, so we will only discuss the results of the Install, ISO and Programs patterns which illustrate the most characteristic use of the drives.
NTFS File System
- FC-Test results in NTFS (table)

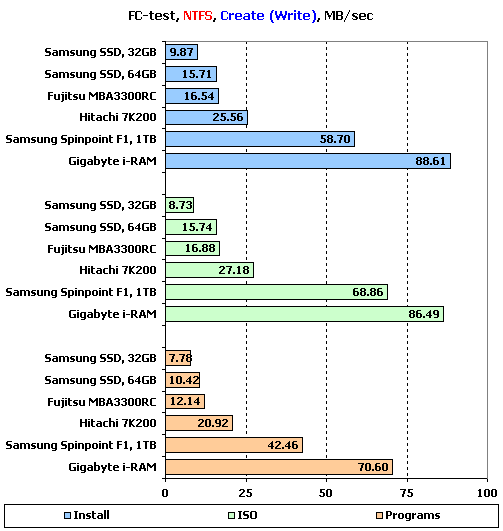
Yes, writing is the hardest operation for SSDs. They are far slower than the others here. The Fujitsu MBA3300RC has a surprisingly low speed which must be due to the controller’s operation with SAS drives (other HDDs with the SAS interface are just as slow on this controller). As you might have expected, the Gigabyte i-RAM wins this test with a large lead.
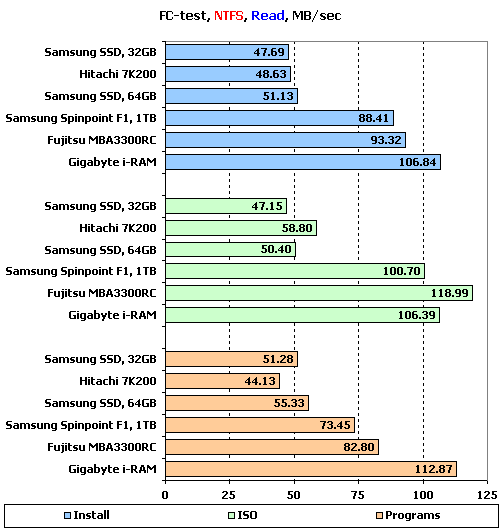
The read speed of the SSDs corresponds to their results in WinBench 99 rather than in IOMeter: Sequential Read. The SSDs are both about as fast as the Hitachi 7K200. Note that their performance does not depend as much on the size of the processed file as with the HDDs. It is because of the file size that the Hitachi 7K200 is considerably faster in the ISO pattern but slower in the Programs pattern. In the same manner, the Fujitsu MBA3300RC overtakes the Gigabyte i-RAM on large files but loses to it on small files.
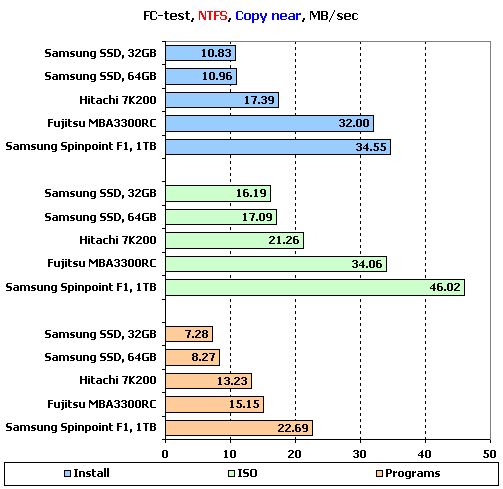
There are a couple of more things to be noticed: the SSDs have similar speeds of processing files although they differed in IOMeter. And the 64GB model is the faster one here. It’s also interesting that the SSDs cope with small files better. This must be due to the lack of buffer memory.
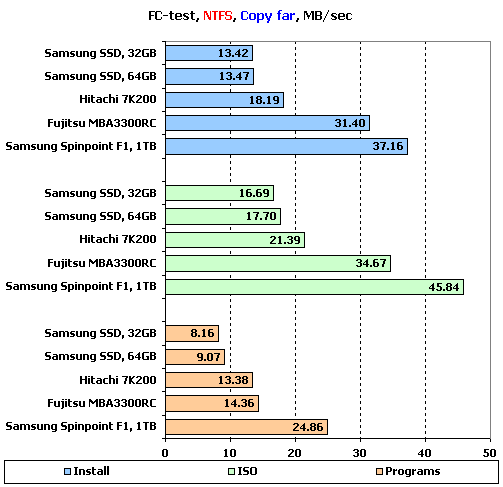
The speed of writing affects the results of copying within the same partition. That’s why the SSDs are slow irrespective of the file-set.
The SSDs are the slowest drives again – copying from one partition to another is not a better load for them.
FAT32 File System
- FC-Test results in FAT32 (table)
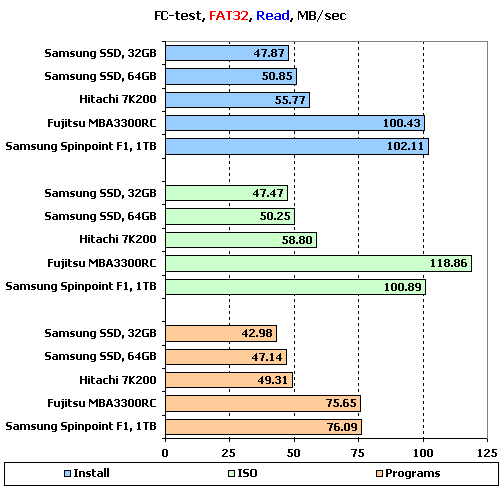
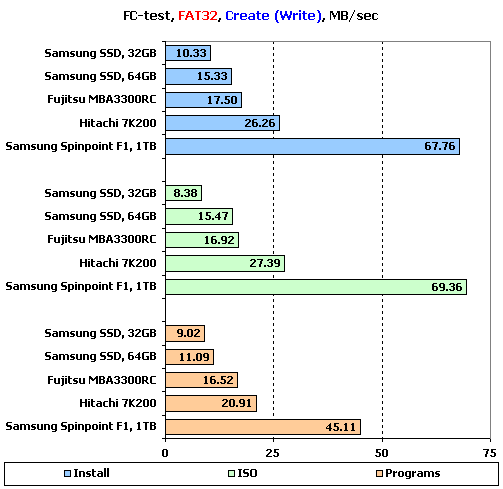
No let’s check out the diagrams for the FAT32 file system:
Performance in PCMark 2004
PCMark04 benchmarks drives in four different modes: Windows XP Startup is the typical disk subsystem load at system startup; Application Loading is the disk activity at sequential starting-up and closing of six popular applications; File Copying measures the HDD performance when copying a set of files; the Hard Disk Drive Usage parameter reflects the disk activity in a number of popular applications. These four parameters are used to calculate the overall performance rating.
We ran each test ten times and averaged the results.
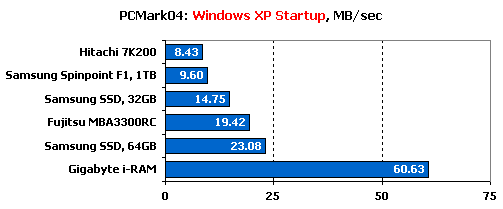
It’s in this test that the SSDs can show their best in due to the low read access time. Apart from the i-RAM which is again far faster than the other drives, the 64GB SSD is the fastest of all. It is followed by the Fujitsu MBA3300RC and by the 32GB SSD. The 7200rpm HDDs are the slowest in this test.
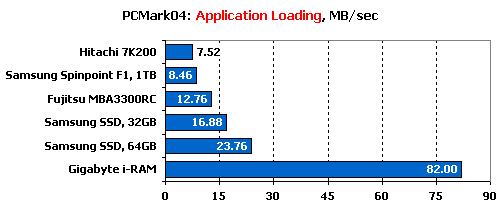
The SSDs also cope well with loading applications, outperforming every HDD including the 15,000rpm model from Fujitsu.
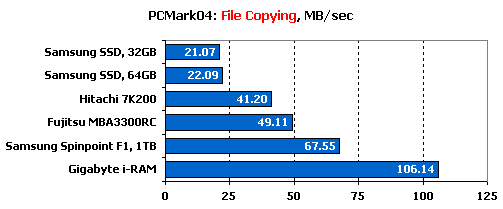
The speed of writing is important at copying. That’s why the SSDs roll back to last places, being far slower even than the Hitachi 7K200. The Gigabyte i-RAM is still in the lead.
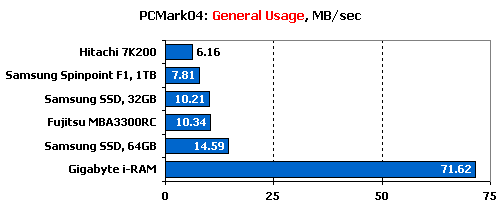
Read operations must be more frequent in general applications than write operations – that’s not surprising, though. As a result, we have the same overall picture as in the Windows XP boot-up test: the SSDs take second and fourth places, the Fujitsu MBA3300RC in between them.
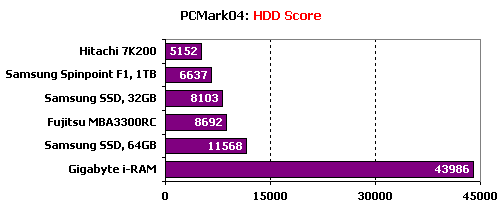
The overall scores coincide with the first and last tests: the Gigabyte i-RAM is the winner, followed by the 64GB SSD. Next go the Fujitsu BMA3300RC, 32GB SSD and the 7200rpm HDDs.
Performance in PCMark 2005
PCMark05 is an updated version of the previous benchmark. Although a questionable test, we still decided to check the drives out in it. Instead of File Copying, there is now a File Write trace. A new trace called Virus Scan is added. Its name is self-explanatory.
Again, we performed each test ten times and averaged the results.
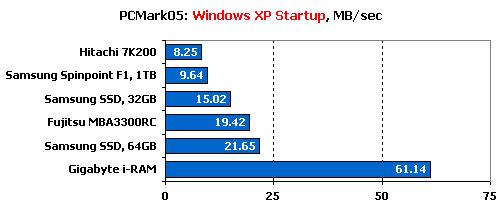
The SSDs show their best at booting Windows again. It’s exactly like we saw in the previous version of the benchmark.
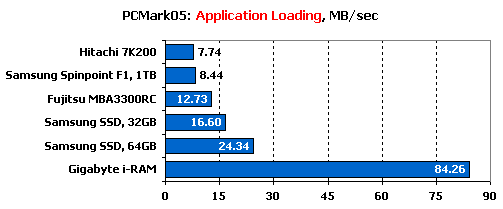
No changes here: the SSDs are ahead of the HDDs when loading applications.
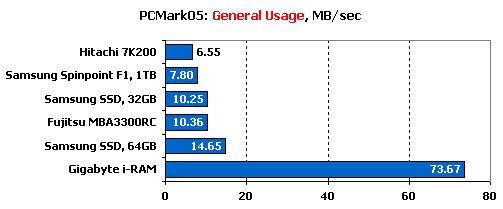
Again, the new version of the benchmark agrees with the older one.
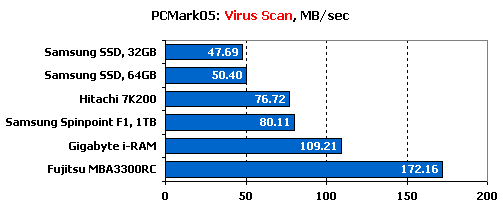
Both reading and writing take place when files are scanned for viruses. The SSDs cannot compete even with the 2.5” Hitachi 7K200 as the consequence.
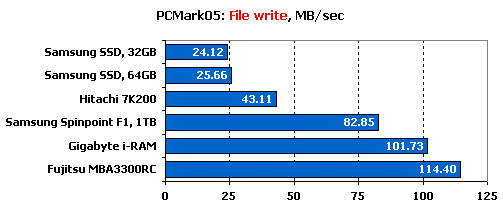
This new trace is all about writing. As in every other test with this type of load, the SSDs take last places.
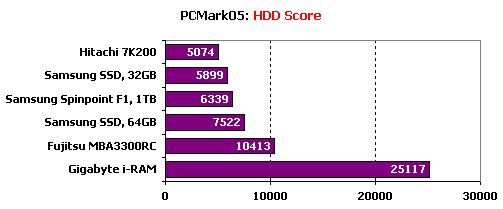
The benchmark including more writing-oriented tests, the SSDs have lower overall scores.
Power Consumption
We will measure the power draw of the drives in three modes: Idle, Random Read & Write, and Sequential Read & Write.
Unfortunately, we couldn’t perform this test for the Gigabyte i-RAM due to the specifics of its power supply. The 64GB SSD from Samsung will be compared with two 7200rpm HDDs.
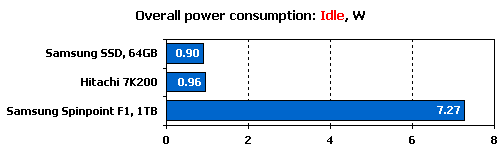
The SSD consumes but slightly less power than the 2.5” Hitachi 7K200 with a spindle rotation speed of 7200rpm. As we know, HDDs of this form-factor but with lower spindle speeds require even less, so they can be even more economical than SSDs. The 3.5” Samsung SpinPoint F1 is much hungrier for power.
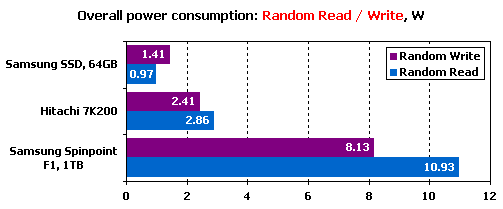
The SSD consumes only half the power the Hitachi 7K200 needs at random reading and writing. The Samsung SpinPoint F1 consumes about three times as much as the 7K200.
HDDs need more power for reading, but SSDs – for writing. It is easy to explain if you remember that each write operation is preceded with the erasing of data in the cell.
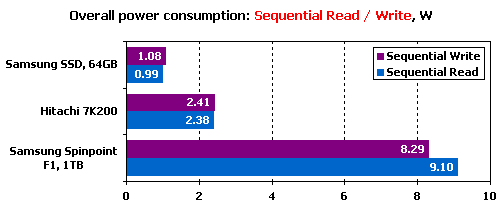
Flash-based drives are even more economical than HDDs at sequential operations. The difference between writing and reading is smaller here. Note that the Hitachi 7K200 consumes less power at sequential reading than at sequential writing. It’s quite different from random operations.
Conclusion
First of all, we would like to say a few words about the Gigabyte i-RAM. We guess it is a superb device for boosting the performance of your PC if you’ve got applications requiring high disk performance but needing no more than 4 gigabytes of storage space. We can think of such applications as Windows’ page file or Photoshop’s swap file. Small databases in servers that require a quick disk response can also be counted in. It is sad there is no i-RAM device that would support a larger amount of memory (preferably DDR2 instead of the outdated and expensive DDR) and the SATA II interface. The i-RAM delivers superb performance under any type of load. The other drives could but seldom compare with it, let alone beat it, in our tests. The form-factor of this device – a full-size expansion card – is not suitable for servers, though. Its applications are thus limited to workstations and entry-level servers. The maximum capacity of 4 gigabytes is unserious, too. Today, modern server platforms allow installing 64 gigabytes of memory and dedicate some of it for a virtual disk that is absolutely free from the interface bandwidth limitations. The lack of support for memory modules with error correction doesn’t allow to use the i-RAM in vitally important applications where every error may be crucial.
Leaving the i-RAM at that, we can proceed to the main subject of this test session, i.e. to the place of Solid State Drives in the modern computer world. To begin with, let’s make it clear what position they take with respect to hard disk drives. If compared with 2.5” HDDs, which were represented in this review by one of the fastest models available, the Hitachi 7K200, Solid State Drives are generally slower in synthetic benchmarks but faster in every version of PCMark (by the way, this proves again that synthetic benchmarks cannot be the only tool for measuring performance). In real-life applications SSDs are going to be faster than 2.5” HDDs with a spindle rotation speed of 5400rpm unless the manufacturer installs very slow chips of flash memory into them.
SSDs are also considerably faster than 3.5” HDDs in terms of random reading but slower at sequential reading. The specific type of load must be taken into account for the latter: HDDs slow down at multi-threaded reading and are overtaken by SSDs. Flash-based drives have lower speeds of writing than modern HDDs, of course.
And finally, ultra-fast HDDs with a SAS interface and a spindle rotation speed of 15,000rpm – the elite of hard disk drives – are only inferior to SSDs under loads with a predominance of random-address read requests. SSDs cannot compete with such HDDs at sequential reading and at writing operations.
So, what would be the most suitable application for Solid State Drives? First of all, it is industrial computers and robust notebooks. In these devices the highest tolerance of flash memory to vibrations would be called for. As a matter of fact, they don’t have serious competitors in this market sector while the increased speed and capacity will allow the user to do a wide range of tasks on such computers.
Second, SSDs are going to be widely used in small notebooks which currently employ very slow HDDs of 1.8” form-factor with a spindle rotation speed of 4200rpm. As you could see in our tests, modern SSDs are quite competitive even to 2.5” HDDs in terms of speed and should easily beat 1.8” ones. The power consumption factor is unclear. We didn’t find SSDs to be more economical, but the difference is small. It won’t affect the battery life much (for example, the replacement of the screen backlight from fluorescent lamps to LEDs will have a much greater effect). We’ll discuss this problem in more detail in our upcoming reviews.
SSDs can also find a place in a small home system where they can show such qualities as zero noise level, small size, and low heat dissipation.
Finally, SSDs are going to be perfect for servers that mostly do random reading. As we’ve seen in the tests, even very fast HDDs with a SAS interface and a spindle rotation speed of 15,000rpm are no match to SSDs in this application. The capacity of SSDs has grown large enough while their low power consumption and small size may be the decisive factors for using in modern slim servers with high component density.
The price factor should be discussed, too. Currently, SSDs have a higher cost of storage than any HDD. Of course, there is the question if such drives can get cheaper except for the steady progress towards larger capacities and lower prices. Well, you can find USB flash drives with a capacity of 16GB costing about $70. Multiply by four and you have $280 for 64 gigabytes of flash memory. When you take 8GB flash drives, the cost of 64 gigabytes is lower at $250. And the size of an SSD allows using several chips of not-the-largest capacity. Thus, we don’t see why a 64GB SSD can’t cost about $250. It would be nice to have slower but cheaper, and faster but more expensive models, for example, if the speed of the chips makes the drive more expensive to make.
So, hard disk drives still remain the best choice in terms of price, capacity and speed combined when it comes to the disk subsystem of a workstation, file server and write operations-oriented server. You just have to understand what your requirements to your disk subsystem are and build the latter accordingly.
As for our requirements to the next generation of SSDs, we’d like to see them larger and faster, of course. Besides, we’d want them to have buffer memory and multi-channel access to the flash memory. Perhaps we won’t have to wait long for such SSDs to come out considering the high development rate of flash memory and devices based on it.

That’s tons of info to digest, impressive keep up the good work!